The World Meteorological Organization confirmed on July 31 that a developing Super El Niño will likely push Pacific sea-surface temperature anomalies past 2.9°C above normal by October, marking a historic intensification. France’s wildfires have already consumed over 42,000 hectares—roughly half the land area of Greater London—and England recorded its driest July in history with only 6.5mm of rain.
What sets this event apart is the simultaneous emergence of a positive Indian Ocean Dipole, a compound climate emergency that reshapes drought and flood risk across three continents. The WMO warns the worst impacts typically arrive around the turn of the year.
A positive Indian Ocean Dipole is developing simultaneously with an intensifying El Niño, tilting rainfall patterns across the Indian Ocean rim just as the Pacific-driven event gathers force. This alignment of two ocean modes creates a compound crisis—two climate systems pushing regional extremes beyond what either would deliver alone. The World Meteorological Organization’s multi-model ensemble projects that sea-surface temperature anomalies in the equatorial Pacific will exceed 2.9°C above normal during August–October 2026. The seasonal average anomaly for July–September 2026 reached approximately 2.0°C, with forecasts showing an upward intensification trend through the autumn. That reading would make the ongoing event one of the strongest on instrumental record.
UN Secretary-General António Guterres called it a situation where “El Niño is strengthening – adding fuel to a planet already on fire with scorching heat domes, apocalyptic wildfires and record hot seas.” WMO Secretary-General Celeste Saulo told member states in late July that the window to act is narrowing. The secondary effects on food supply and energy demand will travel far beyond the immediate flood and drought zones.
The ocean anomaly that doubles the risk
The WMO’s July 31 Global Seasonal Climate Update confirms that a strong El Niño is intensifying steadily, with a 63% probability it will reach a “very strong” category by November–January, ranking among the largest events since 1950. The organisation places extreme probabilities—above 80%—on above-normal sea-surface temperatures across the equatorial Pacific east of the Date Line. That is the engine. The amplifier is the Indian Ocean, where a positive dipole phase is forecast to develop, carrying a seasonal mean value of 0.6°C for July–September.
When these two phases co-occur, the Indian Ocean Dipole acts as a secondary heat distribution system. Warmer western Indian Ocean waters inject additional moisture into atmospheric circulation, while cooler eastern waters suppress convection near Australia and Indonesia. The resulting rainfall tilt overlays the El Niño pattern, deepening the drying in some regions and the flooding in others. The WMO’s seasonal outlook projects below-normal rainfall over the Indian subcontinent and southern and eastern Australia, while the Greater Horn of Africa, southern Europe, and western North America face elevated flood risk through October.
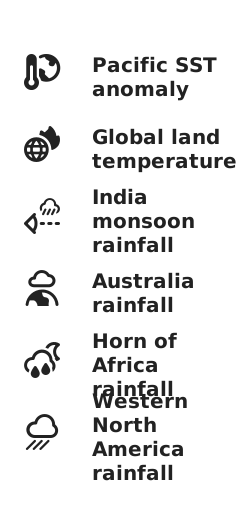
The European experience already shows what the forecast implies. France’s wildfires had burned 42,000 hectares by mid-July, exceeding the total area burned in all of 2025. England and Wales received 6.5mm of rain in July—10% of the long-term average. South Korea recorded 42.5°C, its hottest temperature in a century. These are not projected outcomes. They are the opening months of an event whose thermal peak is still ahead.
NOAA’s August ENSO evolution report frames the probability directly: a 63% chance of a very strong event by early 2027. That ranking puts it in the company of 1982-83, 1997-98, and 2015-16—but the world it arrives on is warmer. Average ocean heat content is at a record high. The residual warmth from the 2023-24 El Niño left little time for a thermal reset. The combination means each degree of anomaly now translates into more available energy for extreme weather.
| Metric | Figure | Source | Date |
|---|---|---|---|
| Niño 3.4 SST anomaly forecast | 2.9°C above normal | WMO Global Seasonal Climate Update | July 31, 2026 |
| Global land areas with above-normal temperatures | >80% probability | WMO Global Seasonal Climate Update | July 31, 2026 |
| India monsoon rainfall anomaly | Below normal | WMO Global Seasonal Climate Update | July 31, 2026 |
| Australia rainfall anomaly | Below normal | WMO Global Seasonal Climate Update | July 31, 2026 |
| Greater Horn of Africa rainfall | Above normal | WMO Global Seasonal Climate Update | July 31, 2026 |
| Source: World Meteorological Organization | |||
Celeste Saulo’s language is careful—she stresses a “window of opportunity” for governments to act before impacts unfold, not a promise that preparation will eliminate the damage. The distinction matters. The WMO’s operational classification uses “strong” and “very strong”—the term “super El Niño” is media shorthand, not an official category. But the 2.9°C projection lands in territory that even cautious institutional language cannot make ordinary.
A warmer starting point with no analogue
The mechanism driving this event is not new. El Niño is a recurring Pacific oscillation. What has changed is the baseline. Average global temperatures have risen approximately 1.2°C above pre-industrial levels. Ocean heat content has reached levels that keep the thermal inertia of the system elevated between events. Adam Scaife, head of long-range forecasting at the UK Met Office, has stated that this El Niño is very likely to cause a temporary spike in global mean temperatures, with residual heat potentially making 2027 the warmest year in the instrumental record since 1850.
Jeffrey Shaman, a climate and public health researcher at Columbia University, describes the mechanism in physical terms: the El Niño will transfer a large volume of stored ocean heat into the atmosphere, creating conditions for a Northern Hemisphere summer in the following year “like we’ve never experienced globally.” The delayed impact is a feature of how these events work. Peak Pacific warming arrives around the turn of the year, but the atmospheric consequences—heat stress, crop failure, hydrological disruption—unfold over the months that follow. The WMO’s next Global Seasonal Climate Update, expected in late September, will reveal whether Niño 3.4 anomalies are climbing toward the 3.0°C threshold that would signal a historically exceptional peak.
The Western footprint on these dynamics is indirect but measurable. European and North American demand for beef, palm oil and coffee shapes land-use decisions in Brazil and Indonesia that increase deforestation. Aviation and tourism from wealthy countries add to the CO₂ load. Investment in fossil-fuel infrastructure continues to expand capacity. None of this causes an El Niño—that is a natural oscillation—but together it raises the baseline on which the natural cycle operates, making the heatwaves, droughts and floods that follow harder than they would otherwise be. Josefa Sacko, the African Union Commissioner for Agriculture, estimates the potential economic losses across Africa alone at US$10–20 billion if drought and flood projections fully materialise.
Beyond the headline
The Bigger Picture
The simultaneous emergence of a strong El Niño and a positive Indian Ocean Dipole is a textbook case of multiple ocean–atmosphere modes aligning to push the climate system beyond familiar bounds. Rather than a single anomalous season, the world enters a period where baseline warming plus interacting teleconnections reshape rainfall and temperature patterns across continents, stressing food systems, infrastructure and health services in ways past El Niño analogues cannot fully anticipate.
The Reach
One actor at the centre of the implication chain is the international food-trading system. As El Niño-linked drying reduces harvests in India, Australia and parts of South America, the mechanism is tighter export supply and price spikes for staple grains, coffee and sugar. For Western sectors that assume continuous cheap imports, this means higher retail food prices, margin pressure for retailers and heightened inflation risk for central banks already contending with climate-sensitive volatility.
The Timing
This El Niño arrives just after the 2023–24 event helped drive 2024 to record global temperatures, meaning there has been little thermal reset time for oceans, ice and ecosystems. The 2026 onset coincides with ongoing energy-transition debates and strained disaster-response budgets, so the timing compresses policy space: governments must simultaneously manage immediate hazard forecasts, rising adaptation needs and negotiations over fossil-fuel phase-out, all while the lagged impacts of the previous El Niño still reverberate through insurance markets.
The decisions that cannot wait until peak season
With the strongest Pacific warming still months away and the Indian Ocean Dipole amplifying the pressure on rainfall systems, four groups face decisions that will shape their exposure through early 2027.
- European tour operator with Southeast Asia packages
You need to reassess itineraries in destinations facing compound heat and flood risk—South Korea, parts of Indonesia, and Thailand’s monsoon-affected zones. Check the WMO’s regional climate outlooks for country-level hazard maps, and prepare flexible rebooking terms for the November–February peak period when heat stress and rainfall extremes are most likely to disrupt travel.
- Western investor with APAC agricultural commodity exposure
Evaluate your portfolio’s exposure to Australian wheat and beef, Indian rice and sugar, and South American coffee—all face supply-side pressure from projected rainfall deficits. Monitor India’s monsoon progress through the Indian Meteorological Department’s weekly updates; if September cumulative rainfall stays below 85% of the long-term average, expect export restrictions by December. Hedging through drought-resilient crop futures or shifting allocation toward Southeast Asian producers with neutral rainfall outlooks can reduce concentration risk.
- UK-based supply chain manager sourcing from Asia-Pacific
Identify critical inputs whose production is concentrated in regions flagged for below-normal rainfall: Indian pharmaceuticals, Australian bulk commodities, and Southeast Asian electronics components in flood-prone zones. Build inventory buffers of 6–8 weeks for high-exposure items now—before the October–December period when both drought impacts on production and flooding impacts on logistics typically compound. Consult WMO’s Global Seasonal Climate Update for the rainfall anomalies map affecting your key supplier regions.
- Western parent of a university student in South Korea
North-east Asia faces elevated heat stress through the autumn semester. South Korea’s official guidance already urges curtailment of outdoor activities after temperatures hit 42.5°C, and the intensifying El Niño means similar extreme-heat days are likely through September. Ensure your student has access to air-conditioned study spaces, understands the national heat-health alert system, and has a contingency plan—including emergency funds—for medical costs if heat-related illness occurs.
Explainer
- Indian Ocean Dipole
- A climate pattern defined by the difference in sea-surface temperatures between the western and eastern Indian Ocean. During a positive phase, warmer western waters and cooler eastern waters shift rainfall toward Africa and away from Australia and Indonesia. When a positive IOD coincides with El Niño, the combined effect historically amplifies drought in the Indian subcontinent and Australia while increasing flood risk in the Horn of Africa.
- El Niño
- The warm phase of the El Niño-Southern Oscillation, a natural Pacific Ocean cycle occurring every two to seven years. Trade winds weaken or reverse, allowing warm water to pool in the central and eastern tropical Pacific, raising global average temperatures and altering rainfall patterns across continents. The WMO classifies El Niño events as weak, moderate, strong, or very strong—”super El Niño” is not an operational category in official products.
- Niño 3.4
- A rectangular monitoring region in the central equatorial Pacific—roughly 120°W to 170°W—used as the primary reference area for El Niño classification. Sea-surface temperature anomalies in this zone determine whether an event is considered weak, moderate, strong, or very strong under WMO criteria. The 2.9°C anomaly projected for August–October 2026 places the current event at the upper boundary of historical measurements for this region.
RELATED STORIES