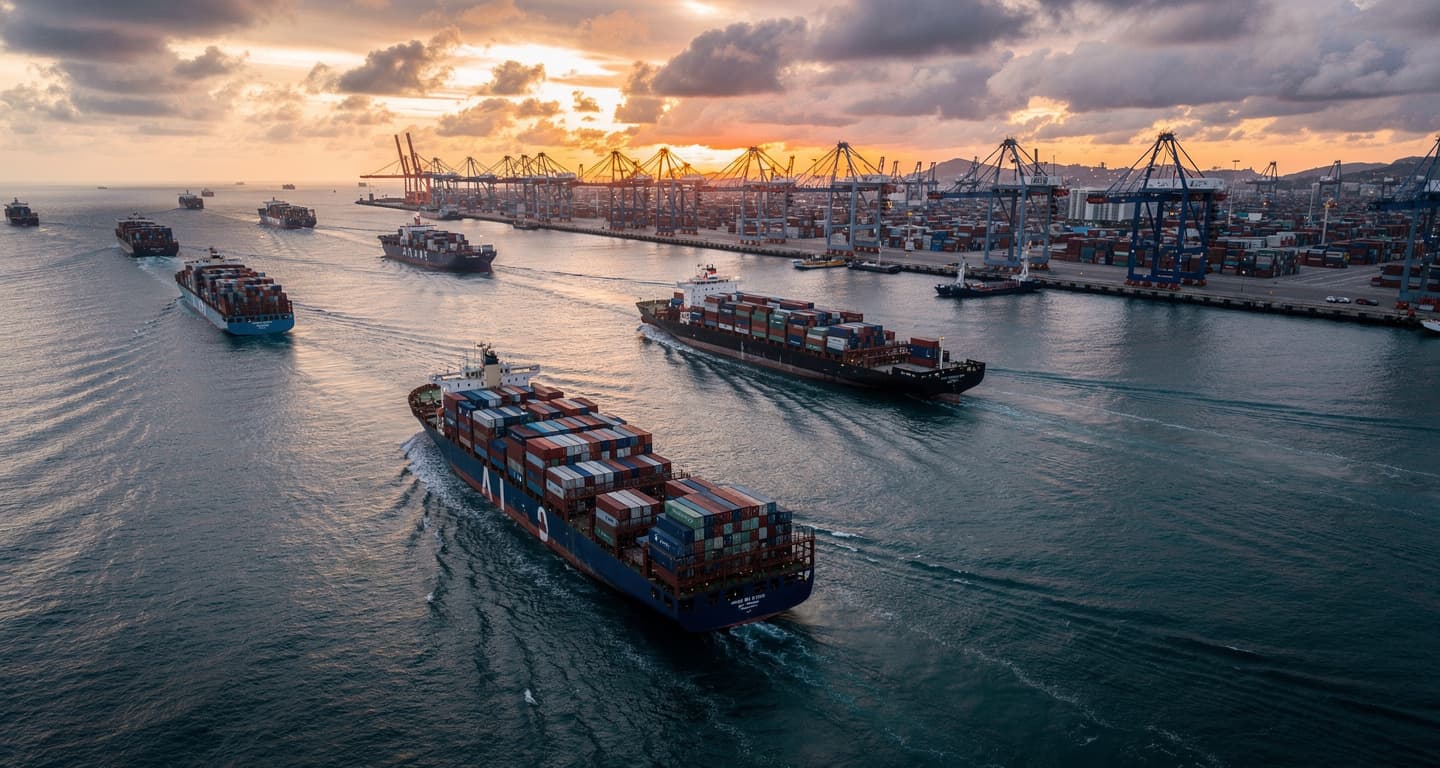
A mid-2026 survey of 180 Asia-Pacific shippers finds that 71% expect air and ocean cargo demand to increase in the second half of the year, even as 92% report higher freight rates and 42% changed their primary logistics provider in the past twelve months.
The findings, from global freight forwarder Dimerco, treat persistent shipment delays not as a temporary shock but a structural cost of trade. Spot container rates on the crucial Far East–U.S. West Coast lane remain over 230% above pre-crisis levels.
Forget the headline about resilient demand. The number that reframes everything else from Dimerco’s new shipper survey is 42%.
That is the share of 180 mostly Asia-Pacific-connected shippers who fired their primary logistics provider in the past year. Another survey might have asked about volumes or outlooks alone. Dimerco asked who you are paying to move your goods—and nearly half the respondents named a different company than a year ago.
The shift is not about a single geopolitical shock or a temporary rate spike. It signals that after years of Red Sea detours, Hormuz anxieties, and port congestion, Asia Pacific’s shippers have stopped waiting for stability. They are treating the slog of chronic disruption—delays every month for 59% of them—less like weather and more like gravity. And in that world, loyalty is the first cost cut.
A market where half the shippers are looking
Dimerco’s data, collected in mid-2026 and released on July 15, captures a market in motion. Among shippers who switched, 70% cited pricing and 60% cited service reliability. One in four moved for better regional coverage. Capacity availability and digital visibility also factored, but the main story sits in that overlap: for 35% of switchers, price and reliability were both dealbreakers.
According to Dimerco’s report, delays are no longer occasional exceptions. The planning conversation now includes route options, compliance readiness, allocation planning, and decision thresholds before disruption hits. The language has shifted from contingency to constitution.
Where disruption bites hardest tells its own story. The Asia–North America corridor is the epicentre, cited by 57% of active air users and 61% of active ocean users. Asia–Europe ranks second. The causes—geopolitical disruption, port congestion, customs and regulatory delays—are familiar. What is new is the admission that 84% of shippers now change shipment strategies frequently or occasionally, treating modal and route shifts as operational norms rather than crisis responses.
The demand drivers behind this scramble are, in some ways, the most reassuring part of the picture. Geopolitics tops the list at 32.7%, but underlying demand growth comes in a close second at 30.5%. Economic conditions account for another 20.4%. Shippers are not merely reacting to chaos; they are trying to move more goods. The cost squeeze is real, but so is the appetite for movement.
| Metric | Figure | Source | Date |
|---|---|---|---|
| Asia GEP Volatility Index | 1.95 | GEP/S&P Global | June 2026 |
| Far East–USWC spot rate | USD 7,069/FEU | Xeneta | July 10, 2026 |
| Far East–USEC spot rate | USD 8,808/FEU | Xeneta | July 10, 2026 |
| Shippers raising freight rates | 92% | Dimerco | Mid-2026 |
| NZ exporters facing higher costs | 87% | DHL Export Barometer | 2026 |
The price of not trusting the system
The rate numbers land hard. Xeneta data recorded Far East–U.S. West Coast spot container rates at USD 7,069 per FEU for the week ending July 10. The East Coast figure sits at USD 8,808. Both have more than doubled since late February. Peter Sand, Xeneta’s chief analyst, is blunt: “This is by no means an end to the freight rate spike.”
Underneath the spot-rate trauma, a broader pattern is hardening. The GEP Global Supply Chain Volatility Index, produced with S&P Global and drawn from roughly 27,000 companies, kept all three major regions above zero in June 2026. Asia read 1.95, down from 2.96 in May but still signalling stretched capacity. John Piatek, a GEP vice president, notes that elevated stockpiling and order backlogs mean “businesses still don’t trust the global trading environment to remain stable.”
Carriers added capacity—5.5% week-on-week on the West Coast, 6.2% on the East Coast, per Xeneta. That injection helped move goods more reliably but has not broken the pricing fever. The asset-heavy players collect the revenue. Selina Deadman of DHL Express New Zealand observes that trade is “becoming more complex and less predictable,” squeezing exporter margins as they chase growth.
The switching rate captures the downstream effect. When neither price nor reliability is a given, contracts become provisional. The cost of disruption is no longer just freight bills. It is the overhead of constant negotiation, the drag of inventory buffers built for fear rather than demand, and the slow migration of trust from partners to diversified portfolios of routes and vendors. For an Indonesian manufacturer trying to land goods in Long Beach, the 276% rate surge since February is not an index point. It is a cash flow question with no clear answer for Q4.
Beyond the headline
The bigger picture
Global trade has entered a phase where disruption is baked into operating assumptions. The Dimerco survey and parallel indices show firms are simultaneously raising buffer stocks, switching providers, and accepting structurally higher transport costs. This revalues supply chain resilience as a core strategic asset rather than a support function.
The money trail
Behind the sentiment shifts is a redistribution of value along the logistics chain. Elevated spot rates on Asia–North America routes mean more revenue flowing to ocean carriers, air cargo operators, and port infrastructure owners. Manufacturers and retailers absorb the margin pressure. The winners are asset-heavy players that can capitalise on swings; those locked into thin-margin product markets face constrained pricing power.
The reach
These APAC supply chain dynamics feed into Western financial markets through inflation expectations. Sustained logistics cost pressure and stockpiling in North America can nudge core goods inflation, shaping central bank trajectories and investor appetite for rate-sensitive sectors. Elevated freight rates may simultaneously bolster transport and infrastructure equities, shifting index composition and performance drivers.
Three decisions when disruption is the baseline
Settlement talks and peak-season capacity injections dominate the coming quarter, leaving Western companies with Asia-exposed supply chains facing a clear set of choices.
- Western Supply Chain Manager Importing from APAC
Re-evaluate logistics provider relationships now. With 42% of shippers switching in the past year, the market is fluid. Benchmark your current contracted rates against Xeneta’s weekly spot data—$7,069 per FEU to the West Coast on July 10—and audit whether your provider’s regional coverage and reliability metrics match your exposure. A multi-provider strategy, with allocation tied to specific lanes and contingency thresholds, is the emerging standard.
- Investor with Exposure to Global Logistics and Manufacturing
The revenue tailwind for carriers is real but narrowing. Monitor GEP’s monthly volatility index; if Asia remains above 1.5 and North America above 1.0, demand and pricing hold through Q3. If indices approach zero by August, expect a rapid shift from spot-rate windfalls to long-term contract renegotiations. Retail and manufacturing holdings with trans-Pacific exposure face a margin squeeze that has not yet fully landed in earnings estimates.
- E-commerce Business Owner Sourcing from Asia
Inventory buffers need a hard reset. The 84% of shippers already changing strategies are your competitors. Adjust pricing models for landed costs at $7,000-plus per FEU and build lead-time assumptions around the 59% of shippers experiencing monthly delays. If you hold a single logistics contract, diversify now—capacity availability was a key switching trigger, and peak season will test the loyalty you have not yet stress-tested.
FAQ
How shippers are changing shipment strategies
Dimerco’s survey indicates that 84% of shippers have changed strategies frequently or occasionally due to disruption. This typically includes increasing buffer inventories, using multimodal routings, shifting freight from ocean to air during peak volatility, and rebalancing origin ports to avoid congestion or conflict-affected corridors such as the Strait of Hormuz. These changes often demand closer coordination with forwarders on allocation planning and contingency routes.
How often global supply chain volatility data is updated
The GEP Global Supply Chain Volatility Index is published monthly, derived from S&P Global’s PMI surveys of about 27,000 companies in over 40 countries. Regional indices for Asia, North America, and Europe allow firms to track changes in capacity stress, stockpiling, and material shortages on a roughly four-week cycle, supporting regular reviews of lead times, safety stock policies, and transport mode choices.
Using spot rate benchmarks in contract negotiations
Xeneta’s weekly spot rate data—such as the July 10, 2026 readings of $7,069 per FEU for Far East–US West Coast and $8,808 for Far East–US East Coast—is widely used by shippers to benchmark contracts. Companies compare their agreed rates against these indicators to assess whether they are paying a premium relative to the market, and adjust contract terms, volume commitments, or routing strategies accordingly.
Explainer
- GEP Volatility Index
- The GEP Global Supply Chain Volatility Index is a monthly measure of supply chain capacity pressure, produced jointly by S&P Global and GEP from PMI surveys of about 27,000 companies worldwide. A reading above zero indicates stretched capacity—firms are buying more inputs, building safety stock, and seeing longer lead times. In June 2026, Asia’s reading of 1.95 signalled that despite slight easing, the region’s logistics networks remained under strain heading into peak season.
- Xeneta
- Xeneta is a Norway-based ocean and air freight rate benchmarking platform that aggregates real-time contract and spot rate data from thousands of global shippers. Its weekly spot rate indices are among the most closely watched by logistics buyers and sellers for setting short-term pricing and negotiating contracts. The July 10, 2026 reading of $7,069 per FEU for the Far East–U.S. West Coast lane was a critical data point for shippers recalibrating their peak-season budgets.
- Dimerco
- Dimerco Express Group is a Taiwan-headquartered global freight forwarder and logistics provider, operating across major trade lanes in Asia, North America, and Europe. The firm’s mid-2026 survey of 180 Asia-Pacific-connected shippers provided a near-real-time snapshot of demand expectations, cost pressures, and provider-switching behaviour at a moment of acute geopolitical and rate volatility.
- FEU
- FEU stands for forty-foot equivalent unit, the standard measure for a 40-foot-long shipping container used in ocean freight pricing and capacity tracking. Spot rates quoted per FEU represent the cost to ship one fully loaded container from origin to destination port. The week-to-July-10 Far East–U.S. West Coast rate of $7,069 per FEU was the highest sustained level since the pandemic-era freight bubble.
RELATED STORIES